Managing Layers
The Layers panel on the left lists every layer in the project, from the topmost drawing layer down to the basemap. Selecting a layer here drives the Style panel and the Attribute table.
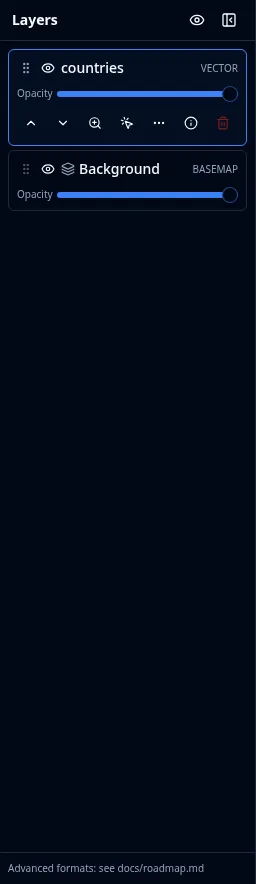
Layer order and visibility
- Visibility: click the eye button to show or hide a layer. The Hide all layers button at the top of the panel hides every layer at once.
- Order: drag a layer to reorder it, or use the move up and move down actions. Layers higher in the list draw on top. The basemap (Background) always stays at the bottom.
- Opacity: each layer has an opacity slider from 0 to 100 percent.
Blend modes
The Style panel carries a Blend menu, above the symbology controls, that sets how a layer's colours combine with the map below it. Opacity dilutes a layer; a blend mode mixes it, so the layers underneath still read through at full saturation.
The classic use is shading: put a hillshade, a terrain raster, or a dark basemap under a thematic fill or an aerial image, set the top layer to Multiply, and the relief shows through the colour instead of being hidden by it. Lowering opacity instead would wash out both.
| Mode | What it does | Typical use |
|---|---|---|
| Normal | Ordinary transparency — the default | Everything else |
| Multiply | Darkens: the two colours are multiplied | Colour or imagery over a hillshade; adding shadow |
| Screen | Lightens: the inverse of Multiply | Lifting a dark layer out of a dark basemap |
| Lighten | Keeps whichever colour is brighter | Overlaying bright features without darkening the map |
| Add | Sums the colours, clipping toward white | Glow effects, heat and density overlays |
Blending applies to a layer's fills, outlines, points, markers, and raster tiles. Labels are deliberately excluded and always draw normally, so place names stay legible over a multiplied hillshade.
Overlapping points and 3D buildings blend twice
Polygons, lines, and raster tiles blend as a whole layer: two overlapping polygons in the same layer combine with the map beneath them, not with each other. Points and 3D extrusions cannot, because MapLibre provides no layer-level compositing step for them, so each symbol blends separately. Where two point symbols overlap on screen the overlap is blended twice and reads noticeably darker under Multiply than the rest of the symbol.
If that shows in your map, reduce the overlap (a smaller radius, clustering, or a scale-dependent minimum zoom), or convert the points to polygons.
A blend mode is saved with the project and travels with a copied style, but it is a GeoLibre rendering setting with no equivalent in the MapLibre or Mapbox style specification, so it is dropped when you export a layer's style to a style file, SLD, or QML.
Why these five modes
MapLibre draws every layer into one WebGL canvas and offers no per-layer blending API, so GeoLibre applies these modes inside the renderer using the GPU's fixed-function blend stage. That stage can express these five and no more. Photoshop-style modes such as Overlay, Colour Dodge, and Soft Light need to read the colours already on the canvas from inside a shader, which is not possible here without an extra full-frame copy on every draw. Darken and Subtract are not offered either: their GPU equations also act on the transparency channel, which would erase the map wherever the layer does not cover it. See maplibre-gl-js#8073 for the upstream work that would widen this list.
Blending is applied while MapLibre draws a layer, so it reaches only the layers GeoLibre itself styles. The following are drawn or styled elsewhere, and so have no Blend menu:
- 3D Tiles, Gaussian splats, LiDAR point clouds, and deck.gl overlays, which draw with their own WebGL renderer instead of MapLibre's.
- Cloud-Optimized GeoTIFFs added through Add Data > Raster Layer, for the same reason on their default rendering engine.
- Vector layers added through Add Data > Vector Layer, which do draw through MapLibre but are styled by their own control rather than by GeoLibre, so there is no point at which the blend mode could be applied.
Everything else blends: local and remote GeoJSON, ordinary raster layers (XYZ, WMS, WMTS), PMTiles, MBTiles, and vector tiles.
Per-layer actions
Each layer exposes a set of actions:
- Open Style panel: when the built-in Style panel is enabled, use the palette button on the layer card to select the layer and open its styling controls.
- Zoom to layer: fit the map to the layer's extent (for layers whose bounds are known).
- Identify features: click features on the map to see their attributes in a popup. On a raster layer this reads the pixel value instead, and on a multiband raster it also builds a spectral profile.
- Labels: toggle text labels for vector layers that have a label field.
- Metadata / Properties: inspect the layer's source and configuration.
- Remove layer: delete the layer from the project.
- Insert before: control where a new layer is placed in the stack.
Importing and exporting styles
Vector layers have a Layer actions → Styles submenu for symbology interchange:
- Export GeoLibre URL style writes a compact
.geolibre.style.jsonfile designed for thedataandstyleURL parameters. It contains no feature data. Its MapLibre render layers use the original GeoJSON filename stem assource, allowing one style document to distinguish GeoJSON members in a ZIP. - Export as Mapbox GL style writes a self-contained Mapbox/MapLibre style with the layer's GeoJSON embedded.
- Export as OGC SLD and Export as QGIS QML produce styles for other desktop and server GIS software.
- Import style (GeoLibre URL / Mapbox GL / SLD / QML)… applies a supported style file to the selected layer. When importing a GeoLibre URL style interactively, the filename-based
sourceassociation is ignored because the selected layer is the target.
To use a GeoLibre URL style, upload it to a CORS-enabled web host and open GeoLibre with both URLs:
https://web.geolibre.app/?data=https://assets.geolibre.app/data/places.geojson&style=https://assets.geolibre.app/data/sample.style.json
See Embedding & Sharing for GeoParquet and PMTiles deep links, ZIP source matching, REST API responses, raster-style JSON, and encoding nested URLs.
Layer groups
Groups are folders in the layer stack. They can nest, so a project can carry a real hierarchy rather than one flat list.
- Create: New group adds an empty folder. New group from layer wraps the layer you are on, and New group from selected layers wraps a multi-selection.
- Fill: Move to group moves one layer, Move selected layers to group moves a whole selection in one step (keeping their relative order), and Add data to group opens Add Data with the new layer targeted at that group.
- Organize: rename a group, collapse or expand it, move it up or down, and set a group-level opacity that applies to everything inside.
- Visibility: hiding a group hides its layers. A layer inside a hidden group is marked Hidden because its group is not visible, so you can tell it apart from a layer you turned off yourself.
- Remove: Ungroup (keep layers) dissolves the folder and leaves its layers in place; Delete group and layers removes both.
Groups and their nesting are saved with the project, and importing a QGIS project brings that project's group tree across.
Refreshing live layers
WFS and GeoJSON URL layers can refresh automatically so the map stays current with a changing source. Open the layer's refresh configuration and choose an interval (for example off, 15 seconds, 30 seconds, 1 minute, 5 minutes, 15 minutes, or a custom value), or trigger a manual refresh.
Each reloadable layer persists a connection record with the project, so the refresh cadence survives a save and reopen. The record also carries the layer's synchronization status — when it last succeeded and the most recent error — which the Layers panel shows, and an on-failure policy that decides whether a failed refresh keeps the last good data or clears it. See Project Format for the schema.
DuckDB layers
Layers added from a DuckDB source or produced by the SQL Workspace support identify, selection, and the attribute table like any vector layer. You can also materialize a DuckDB query result into an editable GeoJSON layer when you want to edit its geometry or attributes.
The basemap
The Background entry at the bottom of the panel is the basemap. Toggle its visibility and adjust its opacity here. To change which basemap is shown, use the Basemaps plugin from the Plugins menu. See Adding Data.
Editing geometry
To draw or edit features directly on the map, activate the GeoEditor plugin from the Plugins menu. It adds drawing, vertex editing, and deletion tools for GeoJSON layers.